Test HK-G07
February 12/06
 |
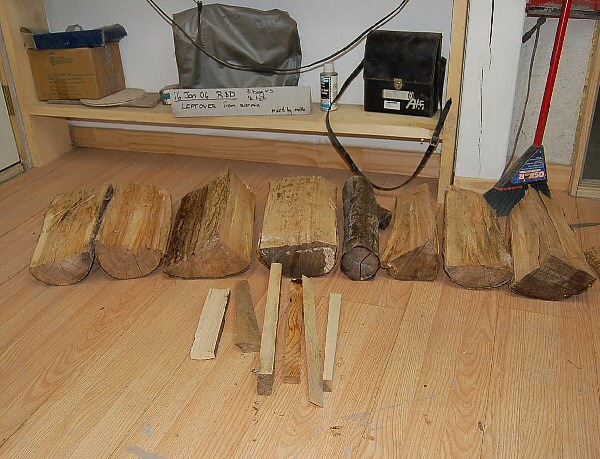
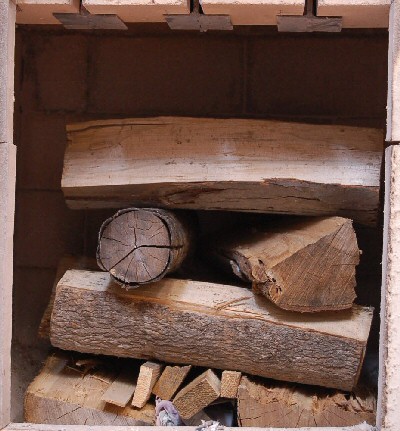
Test HK-G07 Feb 12/06 52.3 lbs Ashbox door left open during the burn (more air). Compare with test HK-G08 (less air) Ashbox door was closed at 45 minutes (reduced air). At 70 minutes, the fire was poked and the grate air was opened |
|
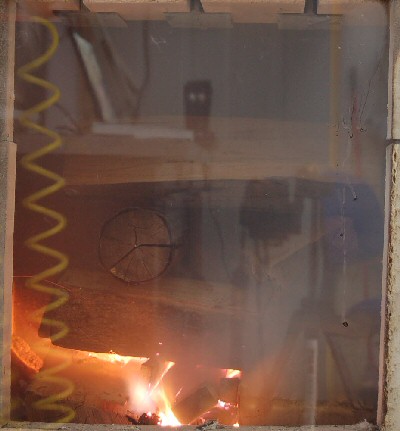 |
This burn was interesting. The kindling was somewhat tight, so the startup was slow. This frame is at 60 seconds, when we see the first opacity spike on the graph |
The animation shows a frame every 30 seconds of the burn for the first twenty minutes. After that, it shows a frame every 5 minutes, so is speeded up by a factor of 10 until the end. The animation loads frame by frame, and then starts repeating at a frame rate of 4 fps. To see it slowly, hit the "reload" button. |
 |
. This frame is at 2:30 minutes. Opacity has reduced. |
The Nikon D50 camera is set on auto exposure. Reflections are visible in the glass due to the long exposure. This only happens at the startup. A manual exposure setting that is suitable for the whole burn would probably be preferable. |
 |
Opacity curve is at the dip in between the first two peaks on the graph. |
|
 |
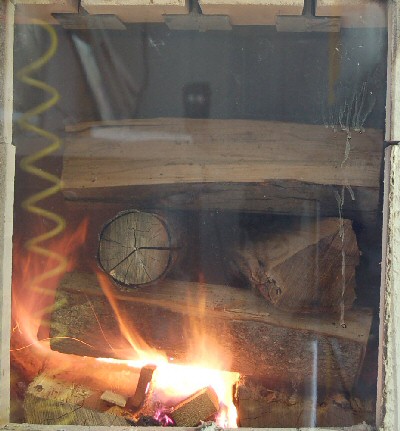
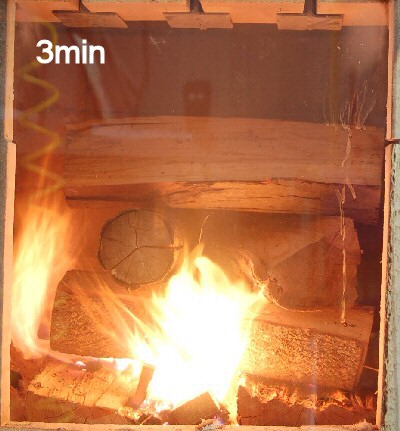
The fire has just started to take off. This is the second opacity peak visible on the graph, and is the point of maximum opacity in the burn. Smoke is evident in the firebox. Note the steep temperature rise and opacity decline right after this point.
|
|
 |
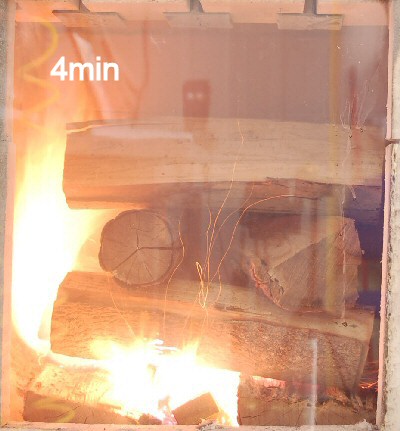
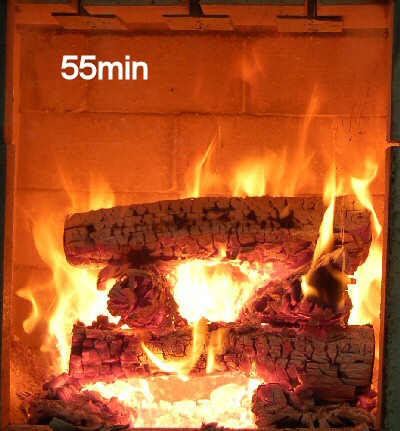
Fire is burning brightly, and wood pile is starting to have a lot of space between the pieces. The ashbox door is closed, which reduces the air supply.
|
Digital cameras are more sensitive to the infrared spectrum. This results in a photo that looks redder than the real fire looks to the eye. We will experiment with the camera white balance setting to try and get a more realistic representation Only rough calibration has been done so far on the laser and CdS photoresistor detector. A 0.3 neutral density filter gave the same opacity reading as in this frame. This represent a light reduction of 1 stop (50%). . |
 |
The graph shows a clear dip in the exhaust temperature, and a small spike in the opacity |
|
 |
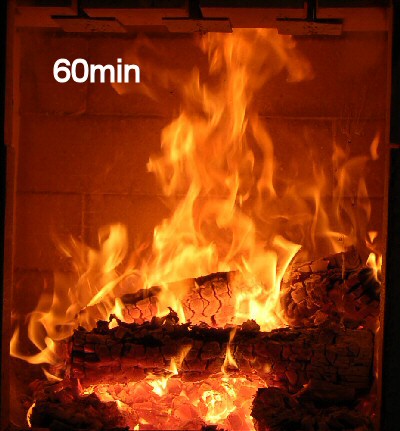
The pile collapses at 1 minute after this photo |
|
 |
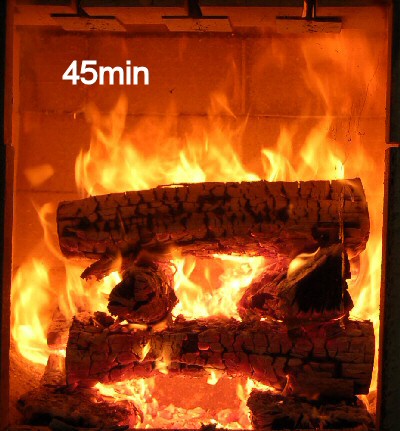
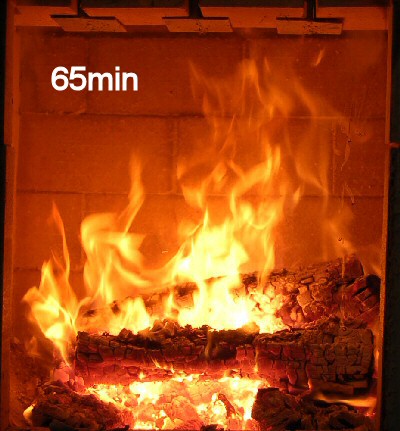
This photo is after the pile collapse, with reduced air. This corresponds with the last opacity peak in the graph, after which the opacity remains at zero. |
Stack temperature at this point is 476F. The opacity would seem to be from non-volatile particulates.
|
 |
||
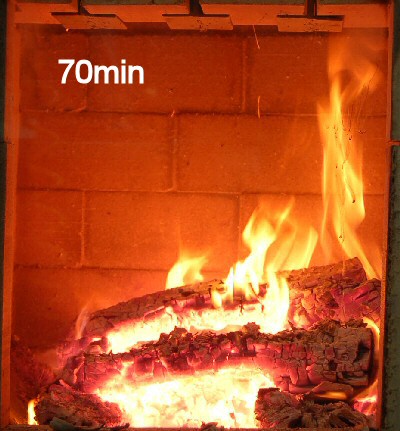 |
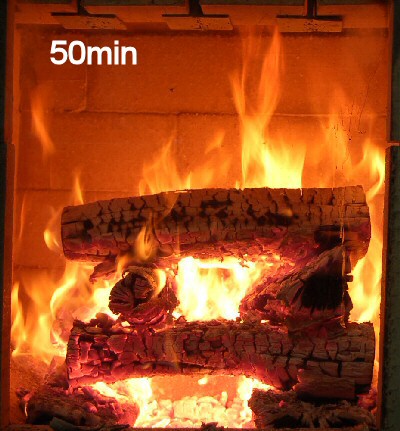
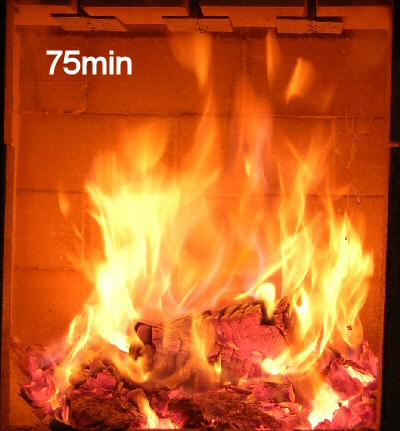
Just after this photo, the remaining wood was poked towards the grate at the rear, and the grate air was openened. No change in opacity. |
|
 |
||
|
|
||
This page was updated on
February 18, 2006
This page was created on February 12, 2006